Data-Driven Design: The User-Centric Approach to Impactful Products
Published on 22 Dec 2023 inCrafting products that genuinely addresses user needs requires thorough insight and research. While skipping the research for faster outcomes may be tempting, designers should recognize that data-driven design is significant and generates better long-term results.
This article delves into the essential considerations and actions required to ensure your designs achieve their intended purpose and goals.
What is Data-Driven Design?
Data-driven design is a methodology for crafting products, services, or experiences that hinges on the systematic gathering and analysis of data to inform and guide the design process. It entails utilizing data and insights to make informed decisions about various aspects of design, including the user interface, product features, user experience, and overall product functionality.
At its core, this approach aims to enhance the efficiency and effectiveness of design by aligning it more closely with user preferences, needs, and behaviors. Ultimately, this can empower digital products to achieve their desired business objectives.
How data affects digital product design
Adobe's research indicates that companies adopting data-driven design can witness a remarkable surge in conversion rates, potentially up to six times higher. The abundance of data gathered by each organization plays a crucial role in shaping design and user experience. Here's a closer look at the details.
Improved User Understanding
Using data to inform design helps designers understand user behavior, preferences, and needs. By analyzing comprehensive user data, designers can identify patterns, trends, and areas for improvement that can help them create designs that are more user-friendly and human-centric in the future.
Data-Driven Decisions
Design decisions based on data are more likely to achieve success than those solely based on personal preferences or business objectives. This is because insights from raw data analysis provide designers with the information necessary to make informed choices about layout, color schemes, typography, and interactive elements, ultimately ensuring a statistically optimal user experience.
User Journey Enhancement
By meticulously analyzing data, designers can pinpoint bottlenecks that hinder the user journey and breed frustration. They can discern where users abandon the process (reducing drops), which features are most frequently utilized, and which pathways lead to desired conversions. This invaluable information can be leveraged to refine the user experience and foster greater user engagement.
Tailored Personalization Strategies
Insights retrieved from data empower designers to create personalized experiences tailored to individual user needs. By analyzing user data, designers can craft customized content, recommendations, and interactions that resonate with each user, fostering a more relevant and personal experience.
Design Hypothesis Validation Tool
Designers often make assumptions about users' behavior and preferences, but data can help verify these assumptions. Analyzing user interactions and feedback allows designers to refine their assumptions to better align with user needs. This ensures that designs are grounded in reality, rather than mere estimation.
Identifying Hidden Problems
Analyzing user data can help designers pinpoint usability issues and areas where users encounter difficulties. By examining data related to user errors, abandoned tasks, and frequently sought help requests, designers can identify problematic design elements and implement changes to enhance the user experience.
Types of Derived Data
The types of data derived from data-driven design are divided into two main categories: quantitative data and qualitative data.
Six Methods to Derive Quantitative Data
Quantitative data encompasses factual information that can be quantified and measured. While this data possesses a high degree of objectivity, interpreting its underlying significance demands a high level of expertise. Sources for collecting quantitative data include:
Analytics Data
The first type is derived from analytics platforms like Google Analytics or Mixpanel, providing valuable insights such as page views, clicks, and bounce rates.

Usability Testing
Usability testing measures both the time it takes users to complete tasks or missions assigned by the test moderator, and the time they spend concentrating on finding specific information.
A/B Testing
A/B testing is a common design review practice that involves assessing data from various iterations of a design to identify the most effective version. This comparison typically includes two or more versions.
Heat Maps
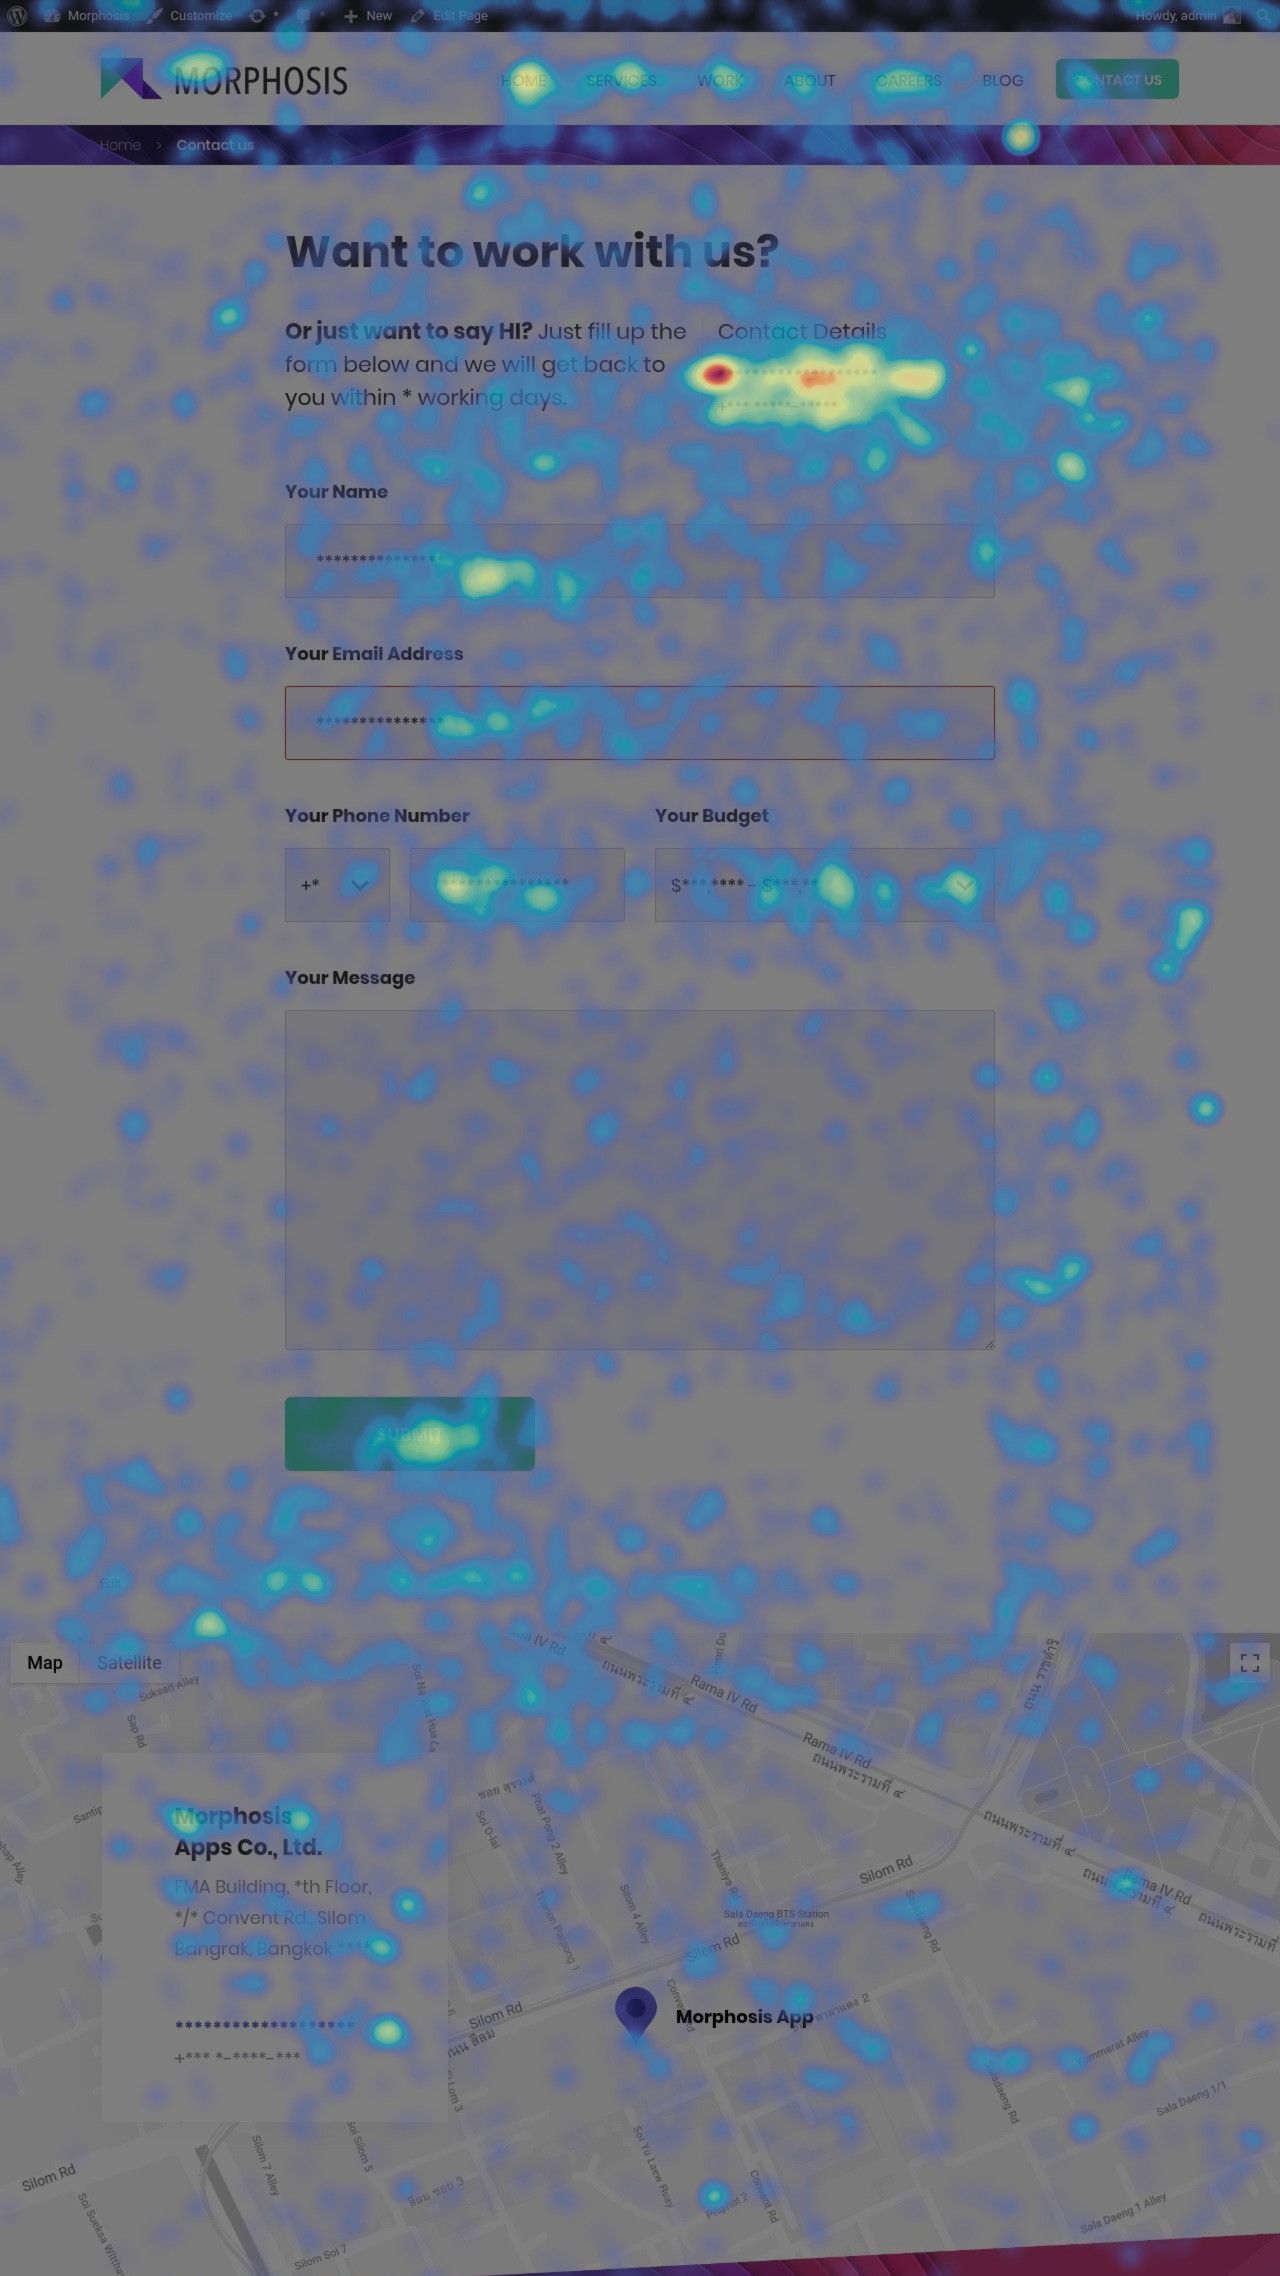
This method generates a clear visual representation of user interaction on your website or digital product using heatmaps. Heatmaps employ vibrant colors to indicate different actions, such as hovering, clicking, or scrolling.
|
|
|
|
Multivariate Testing
This method entails testing a hypothesis by employing multiple variables. It subsequently evaluates the expected outcomes against the actual results to ascertain whether the hypothesis is upheld.
Usage Analytics
User behavior data encompasses information about how real users interact with a product or service. It reveals insights into how users navigate through a website, their preferred features, and the time they spend on different web pages.
Three Methods To Derive Qualitative Data
Qualitative data contrasts with quantitative data in its subjective nature, precluding entirely objective measurement. Despite this subjectivity, qualitative data offers designers a more comprehensive perspective and deeper insights into the underlying motivations behind user behavior.
This understanding empowers designers to refine digital products within the evolving framework of data-driven design.
Survey
Surveys, a time-honored method for gathering user feedback, provide valuable insights into user experiences with digital products.
Focus Group
Qualitative data of this nature is gathered through interviews with users. These interviews are typically conducted in a controlled setting to foster a conducive and productive dialogue.

User Interview
This method starts with creating a set of questions to delve into the deepest aspects of the user experience. The interviews are conducted and user feedback is taken to improve digital products in further iterations.
5 Approaches to Data Analysis
Gathering user behavior data is merely the initial step in gaining a deeper understanding of the target audience. The next step involves analyzing the collected research findings to uncover patterns or insights that will inform future design decisions.
Set Clear Objectives and KPIs
The initial phase of data-driven design involves establishing distinct design objectives and pinpointing Key Performance Indicators (KPIs) that align with these goals. It is essential to have a precise understanding of what you aim to accomplish with your design and the metrics you will use to gauge its success. KPIs may encompass conversion rates, user engagement levels, and user satisfaction scores, for instance.
User Analysis and Data Derivation
The next step involves collecting pertinent user data from a range of sources, including user analysis, surveys, interviews, and feedback. This data should provide both quantitative and qualitative insights into user behavior, preferences, and pain points, enabling a comprehensive understanding of your user base.
User Segmentation and Persona Development
Segment your user data into distinct groups or individual profiles based on relevant demographic, behavioral, or other identifying characteristics. Personas will serve as valuable tools to craft designs that effectively cater to the specific needs and preferences of these differing user groups. Throughout the design process, these personas will act as consistent reference points to ensure alignment with user-centric objectives.
A/B Testing and Iterative Design
Equipped with the necessary data to drive design success, you can now employ A/B testing to evaluate alternative design layouts, features, or content. By analyzing the outcomes of these tests, you can identify the most effective elements and incorporate them into continuous prototyping, a practice known as iterative design. Additionally, A/B testing empowers you to refine new designs for future updates based on user feedback and behavioral insights.
Collecting User Feedback
To finalize a truly data-driven design process, systematically gather user feedback throughout the entire design journey. This encompasses insights gleaned from surveys, interviews, and user testing sessions. Once you've amassed this valuable feedback, prioritize the most prevalent or critical user needs and pain points. Subsequently, refine your design to align with these identified user requirements.
Create Digital Products from Truly Data-Driven Design
Craft products that genuinely resonate with your target audience by embracing data-driven design. Unsure how to implement this methodology into your digital product development? Morphosis is here to guide you. Our team of design, UX research, and other industry experts is committed to helping you create products that your users will adore. Contact us today to embark on your data-driven design journey.
Subscribe to our newsletter.
Here are some related articles
Design Thinking
Let us will help you open new business opportunities by giving you a new perspective on your digital product you may not have considered before.


